Diet & Copper Content Food Table
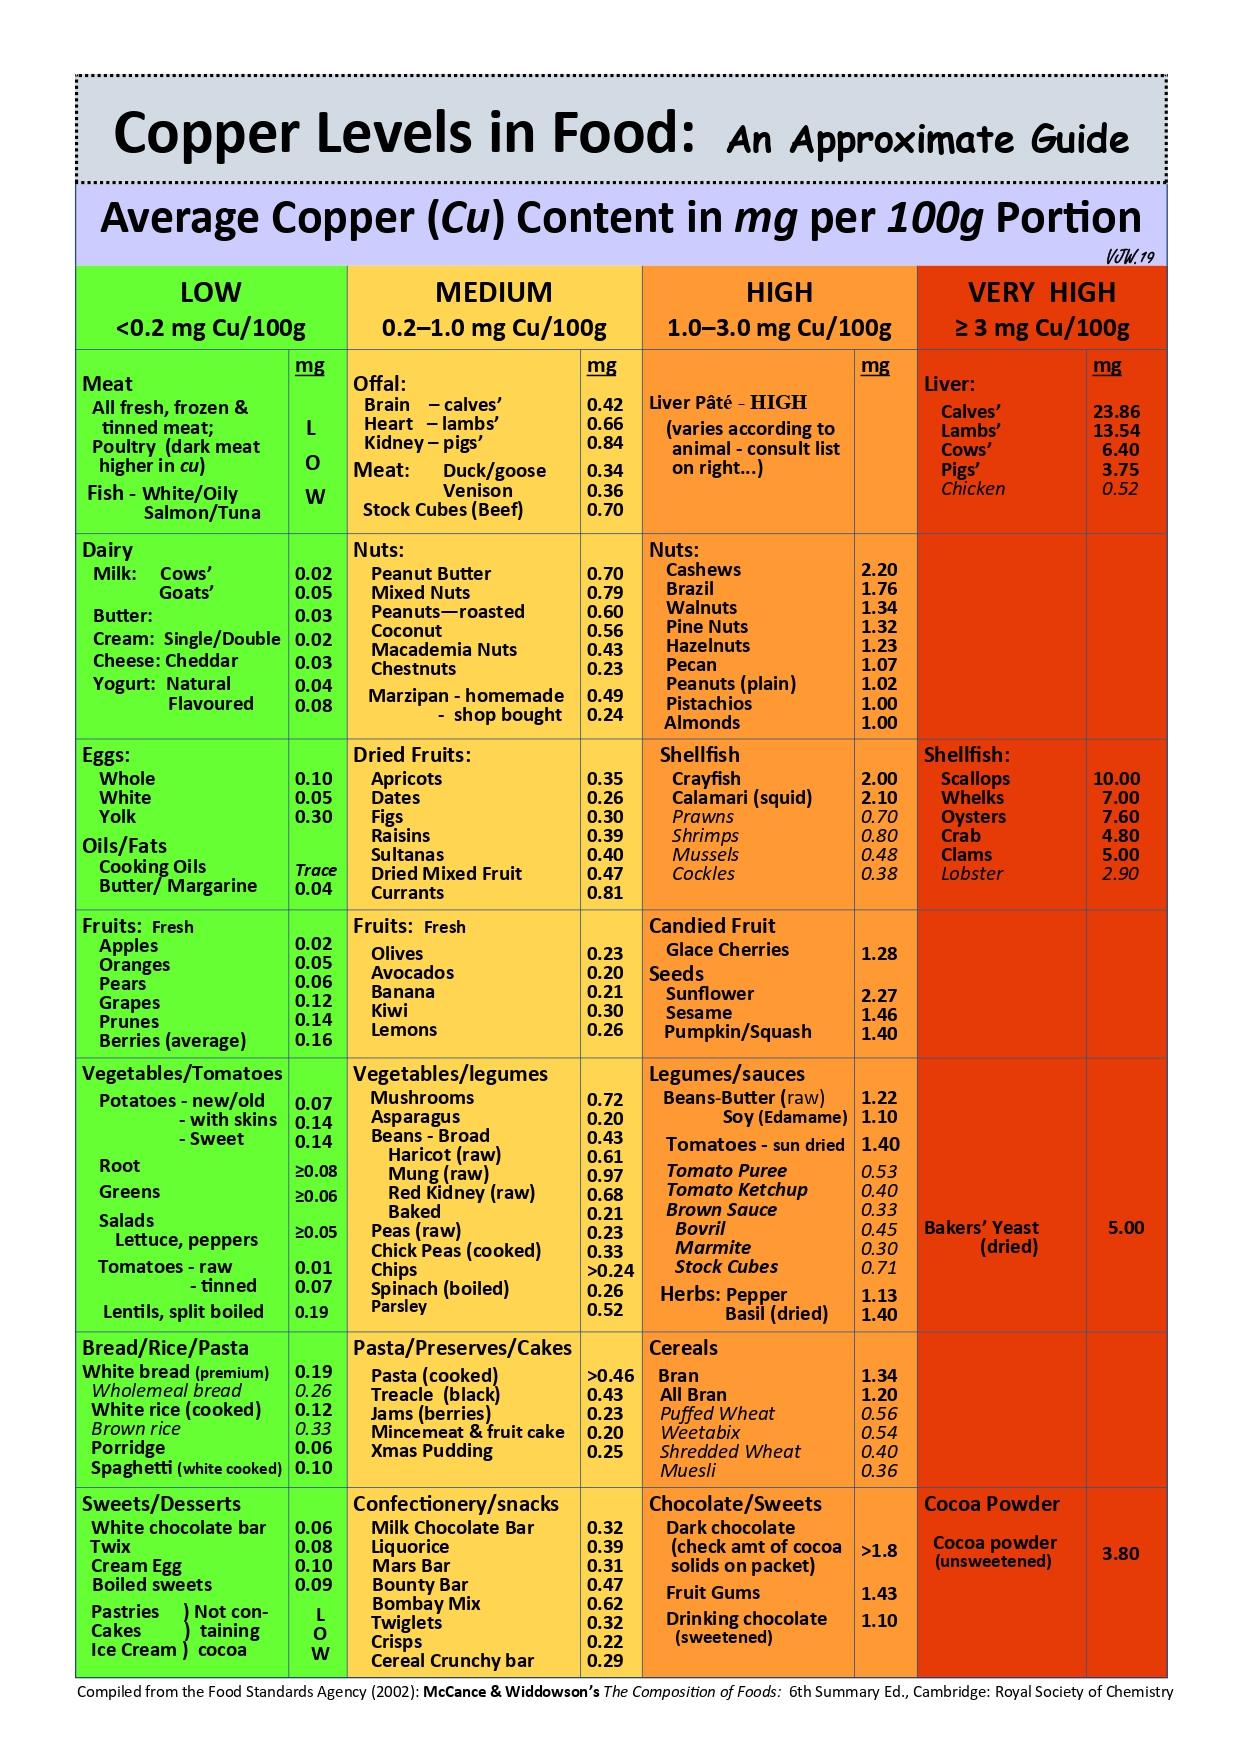
The table has been compiled to show the approximate levels of copper in milligrams per 100 gram portions (mg/100g) of common foods eaten in the United Kingdom.
It is based on average figures quoted in “Food Standards Agency (2002): McCance & Widdowson’s The Composition of Foods, Sixth Summary Edition. Cambridge: Royal Society of Chemistry”. This book itself is obviously far more comprehensive, listing the copper and other nutritional values of 1,235 different foods.
The copper values in the foods in the table shown here are categorised under the headings, Low, Medium, High and Very High, with some foods and their values italicised where they appear in incorrect columns.
For patients whose copper levels are controlled through a good medication regimen, the table shows which foods can be eaten with impunity and which foods should be eaten in moderation. For newly diagnosed patients whose free copper levels are high, it is best to stick to the foods in the low and medium categories until copper levels are controlled.
Valerie Wheater, October 2019


